
The Training Session Doesn't End When You Walk Out

Fatigue from a hard training session doesn't arrive all at once, and how long does muscle recovery take depends on which biological process is completing, not on how the session felt overall. The peak of systemic fatigue often arrives 24 to 48 hours after a hard effort, driven by mechanisms that are still active well after the workout ends. This is the experience athletes label extreme fatigue after exercise: the Monday session that produces its worst effects on Wednesday, the Saturday race that leaves the body compromised through the following Tuesday.
The conventional explanation treats fatigue as simple cause and effect: hard work produces it, rest resolves it. That framing is descriptively true but mechanistically empty. It does not explain why the worst of the fatigue is delayed. It does not account for why the nervous system is suppressed, why glycogen stores remain suboptimal 36 hours later, or why cortisol hasn't normalized. These are distinct biological events with specific timelines, and they run simultaneously.
The more accurate model is this: every training stimulus produces two simultaneous outputs: a fitness signal and a fatigue signal. They are not opposites generated by different processes. They come from the same event. Performance at any given moment is their net difference, not a direct measurement of fitness capacity. Understanding that relationship changes how an athlete reads what their body is actually doing after a hard week.
Performance = fitness − fatigue
—
Every session raises both signals. Fatigue hits harder and fades fast; fitness builds slower and lingers. The gap between them, at any moment, is what you can actually express.
This article covers the biology of fatigue accumulation across three nested timescales, the active cascade that constitutes genuine recovery, what durability means as a distinct performance construct, and how to apply that understanding to the decisions that determine whether training produces adaptation or attrition.
“Performance at any given moment is the net difference between the fitness and fatigue signals, not a direct measurement of total fitness capacity.”
How Fatigue and Fitness Come From the Same Signal
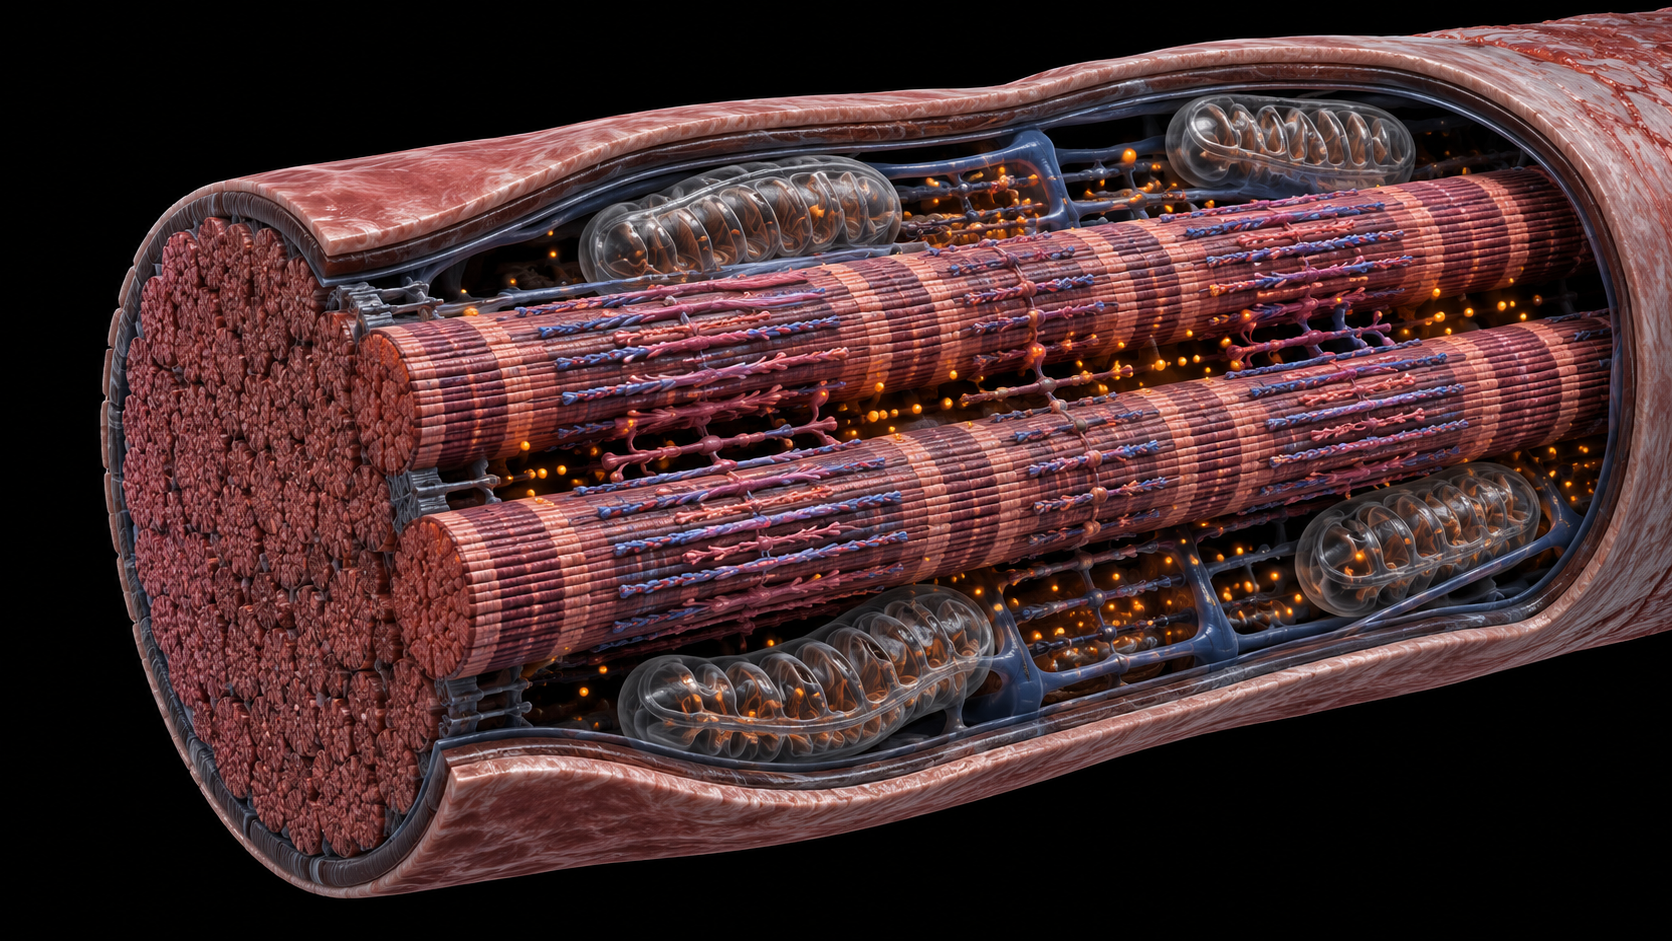
Fatigue is not a single event. It operates simultaneously at the cellular level, the nervous system level, and the organism level across days and weeks. Each layer has its own mechanisms, and the mechanisms interact. To understand why recovery works the way it does, the mechanisms need to be established in sequence.
The Fitness-Fatigue Model: Why Performance Is Never Just a Measure of Fitness
The foundational model for understanding what training actually produces is called the impulse-response model, developed by Banister and refined through subsequent decades of exercise science. It describes how a single training stimulus generates two parallel signals with different decay rates. The fitness component, including improved mitochondrial density, higher aerobic capacity, and better substrate efficiency, builds slowly and decays slowly, over weeks to months. The fatigue component builds faster and decays faster, over days to roughly a week. An athlete's performance capacity at any given moment is the net difference between these two signals, not a direct readout of fitness.(Busso 2003)
This model has a non-obvious implication: feeling depleted in week three of a hard training block is not evidence that the training isn't working. It is evidence that fatigue currently exceeds the visible fitness gains, the expected state during a loading phase. The fitness is accumulating beneath the fatigue signal. It becomes visible when the fatigue dissipates, which is precisely what a taper period is designed to accomplish.
Supercompensation, the transient elevation of performance above pre-training baseline that follows a loading block and adequate recovery, is a direct product of this dynamic. Fatigue decays faster than fitness. When training load reduces and recovery is adequate, the fatigue signal drops, the fitness signal remains, and performance temporarily exceeds where it was before the block. This is why periodized training with structured recovery windows produces different outcomes than continuous high-load training without them.
Inside the Muscle: Peripheral Fatigue at the Cellular Level
Peripheral muscle fatigue originates in the muscle itself, independent of the brain or central nervous system. During a high-intensity effort, three concurrent cellular processes reduce the muscle's capacity to produce force: substrate depletion, metabolite accumulation, and impaired cross-bridge cycling. All three run simultaneously.
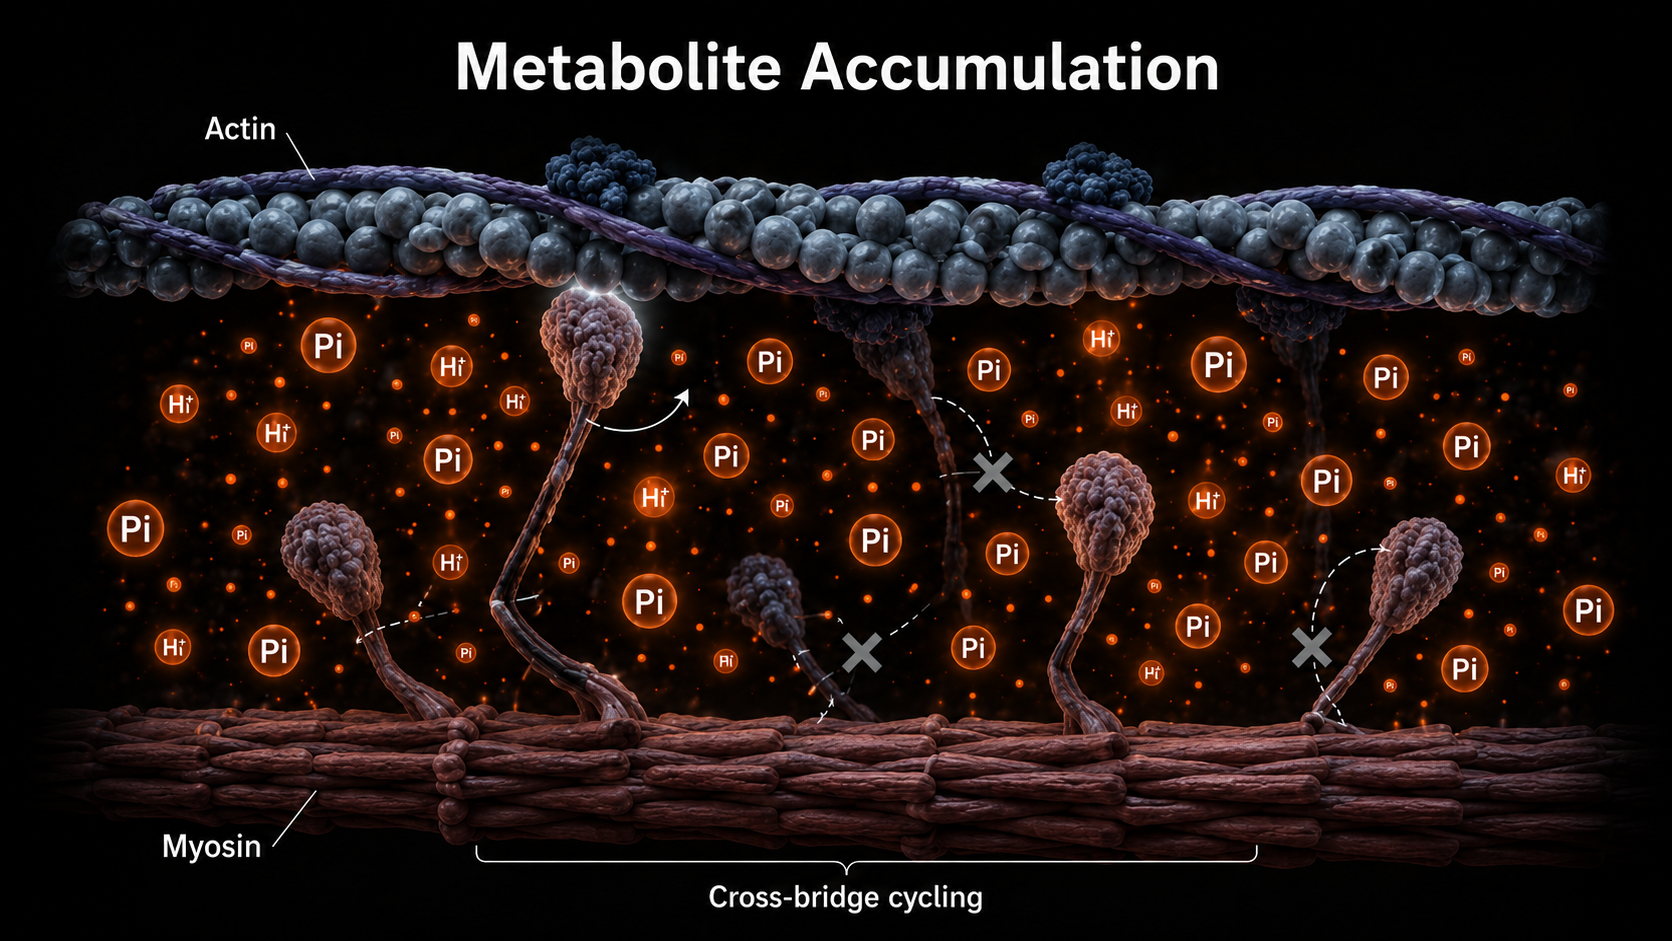
Glycogen and phosphocreatine deplete as the effort continues. Simultaneously, inorganic phosphate and hydrogen ions accumulate in the muscle cell as byproducts of ATP hydrolysis. These metabolites directly inhibit the cross-bridge cycle, the molecular interaction between contractile proteins responsible for force production. The result is a progressive reduction in force output at the contractile unit level, independent of any neural input.(Allen et al. 2008)
Extreme fatigue during exercise is the lived experience of these cellular events: the progressive inability to maintain target output as substrate depletes and metabolite load rises. A common misattribution points to lactic acid as the cause of this failure. Lactate itself is not the primary mechanism. The accompanying acidosis from hydrogen ion accumulation is what inhibits contractile function. Lactate is a fuel the working muscle is actively recycling during the effort, not the agent of failure.
Peripheral fatigue is also distinct from the sensation of effort. A muscle can be peripherally fatigued, measurably less capable of producing force, while the athlete still feels subjectively capable of continuing. The two states often coincide in hard efforts, but they are produced by different mechanisms, and that distinction becomes relevant when interpreting performance decline in training and competition.
What Causes Central Fatigue: How the Brain Limits Output Before the Muscle Fails
Central fatigue originates in the central nervous system and is characterized by reduced motor drive: a decrease in the rate and amplitude of motor unit recruitment that reduces force output independently of the muscle's contractile state. Two mechanisms produce it, and they run in parallel during any sustained effort.
The first is afferent inhibition. As metabolites accumulate in the working muscle, mechanoreceptors and metaboreceptors in the muscle and surrounding tissue send signals back to the brain that progressively reduce efferent motor output. This down-regulation is protective: the brain receives information that the periphery is under significant metabolic load and reduces output accordingly, before structural damage occurs. The consequence is that the central nervous system limits performance before the peripheral muscle is truly depleted.(Marcora 2010)
The second mechanism is neurochemical. Prolonged exercise shifts the brain's serotonin-to-dopamine ratio, elevating serotonin relative to dopamine. This shift raises perceived effort and reduces the motivation to sustain output (Meeusen et al. 2006). The change is real: it is not a motivational failure but a measurable neurochemical output of the exercise load.
Perceived effort climbs as serotonin outweighs dopamine
Prolonged exercise shifts the brain's serotonin-to-dopamine ratio, raising serotonin relative to dopamine. As that ratio climbs, the same output feels harder to sustain — and the drive to keep pushing fades.
Perceived effort
—
Motivation to sustain output
—
Both forms of central fatigue develop alongside peripheral fatigue during any hard session. They are not sequential. In the early stages of an effort, peripheral mechanisms typically dominate. As duration extends and intensity remains high, central contributions increase. Training history, carbohydrate availability, hydration, and sleep quality all influence the rate at which central fatigue accumulates, and this is why two sessions at identical external load can produce dramatically different fatigue outcomes depending on the athlete's state going in.
Why You Still Feel It 48 Hours Later: Fatigue Across Three Timescales
Fatigue accumulates across three nested timescales, each driven by distinct mechanisms and requiring different resolution strategies. The inability to recognize which timescale is active on any given day is one of the most common sources of misread training data.
Acute fatigue, within a single session, is dominated by substrate depletion and metabolite accumulation. Phosphocreatine depletes within seconds of maximal output. Glycogen depletes over the course of a sustained session. Inorganic phosphate and hydrogen ions accumulate. This acute fatigue dissipates largely within hours as PCr restores, metabolites clear through blood flow, and normal cellular chemistry reestablishes.
Short-term fatigue extends across 2 to 7 days and is driven by two primary mechanisms: incomplete glycogen resynthesis and the inflammatory response to exercise-induced muscle damage. Full glycogen resynthesis requires 24 to 48 hours under optimal conditions. In the 24 to 48 hours following a hard session, cortisol remains elevated above baseline as part of the HPA axis response to training stress, suppressing anabolic processes and creating conditions less favorable to repair. Delayed fatigue after exercise is largely a product of this overlapping window. The session itself may not have been excessive; the incomplete short-term recovery is what degrades readiness for the next effort.
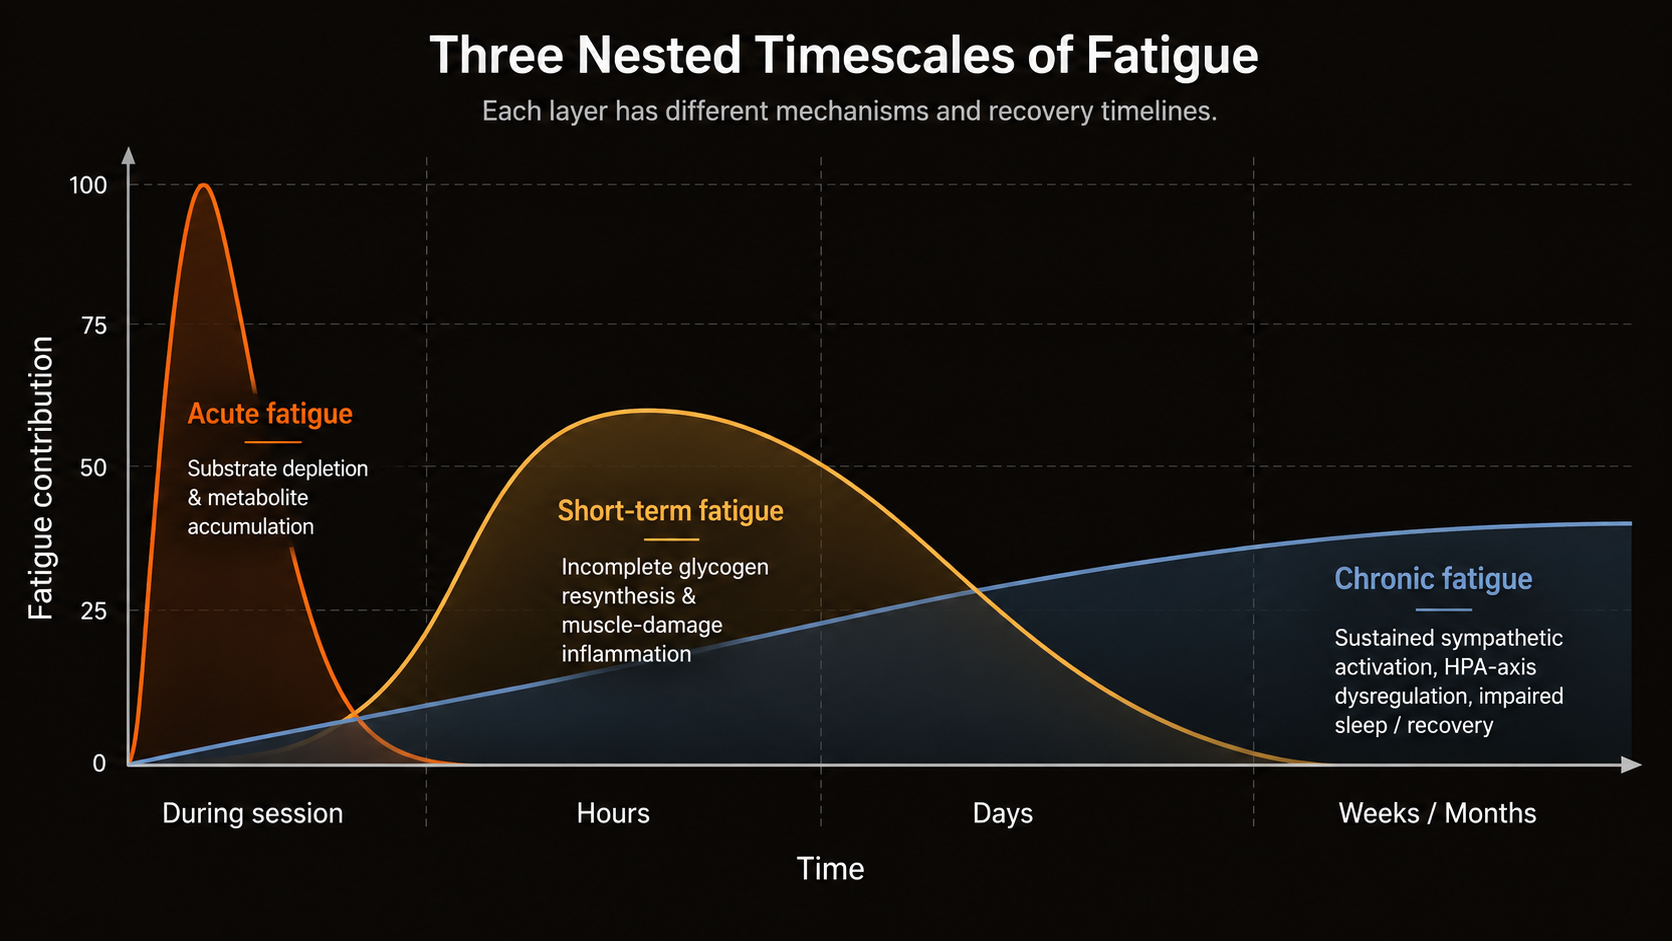
Chronic fatigue accumulates across weeks to months when training load consistently exceeds recovery capacity. Its drivers are autonomic and hormonal: sustained sympathetic nervous system activation, HPA axis dysregulation, and degraded sleep architecture. This is the domain where overreaching develops, and where the distinction between planned fatigue accumulation and unmanaged training debt becomes consequential. All three timescales stack: an athlete in week three of a hard block is managing acute, short-term, and chronic fatigue simultaneously, and each layer compounds the others.
Durability: The Construct That Sits Between Fitness and Fatigue Resistance
Durability is a distinct physiological construct, not defined by aerobic capacity, functional threshold power, or any metric that reflects peak performance. Two athletes with identical aerobic capacity can show dramatically different performance curves over a prolonged effort: one holding output relatively constant through hour three, the other fading significantly from the same starting point. The one who fades less has higher durability.
Durability is defined by the magnitude of power or pace decrement from hour two onward in a prolonged effort, relative to physiological markers established under fresh conditions. High-durability athletes show attenuated decline; low-durability athletes show a disproportionate performance reduction as fatigue accumulates, despite equivalent peak capacity.(Maunder et al. 2021)
The mechanisms behind durability are the same peripheral and central fatigue mechanisms already described, operating at different rates. A high-durability athlete accumulates peripheral fatigue more slowly per unit of output, through better substrate economy, lower metabolite accumulation rate, and more efficient cross-bridge cycling under extended load. Central fatigue also develops more slowly, with motor recruitment remaining more stable as the effort extends.
Durability is trained through chronic exposure to prolonged sessions at low to moderate intensity, the kind of training that builds mitochondrial density, improves fat oxidation capacity, and conditions the neuromuscular system to maintain output under progressive fatigue load. Training exclusively for peak VO2max does not necessarily improve durability, because durability depends on the system's ability to resist fatigue accumulation over time, not on its ceiling at maximum exertion. The distinction matters for any athlete whose events or training sessions last longer than 90 minutes.
PERIPHERAL FATIGUE
Originates in the Muscle
Driven by substrate depletion and metabolite accumulation. Inorganic phosphate and hydrogen ions inhibit cross-bridge cycling, reducing force output at the contractile unit level.
CENTRAL FATIGUE
Originates in the Brain
Driven by afferent inhibition and neurotransmitter shifts. Motor drive reduces before the muscle is depleted, a protective mechanism of the central nervous system.
“The central nervous system limits performance before the peripheral muscle is truly depleted.”
How Long Does Muscle Recovery Take — The Active Cascade

Recovery is an active biological cascade, not the absence of stress. It has specific requirements at each stage and operates on at least five overlapping timelines. How long does muscle recovery take is not answered by a single number: it depends on which biological process is still running and whether that process is receiving the inputs it requires.
Seconds to Minutes: Phosphocreatine Restoration
Phosphocreatine is the primary fuel for efforts lasting 1 to 10 seconds at maximal output: the explosive exchanges, the repeated sprint sequences, the hard acceleration at the end of a round or interval. It depletes within seconds of maximal effort and restores rapidly during passive rest. Approximately 50% of PCr is restored within 30 seconds of passive recovery, and near-complete restoration occurs within 3 to 5 minutes.(Greenhaff et al. 1994)
This is the fastest physiological recovery process in the body, and it is the most directly visible in performance. Repeated sprint performance degrades as rest intervals shorten because incomplete PCr restoration between efforts reduces the energy available for each subsequent burst. The performance ceiling for any PCr-limited output is set by how much PCr has restored since the last similar demand, not by fitness level in isolation.
Hours to Days: Glycogen Resynthesis After Hard Training
Muscle glycogen depletes over the course of a sustained or high-intensity session, and full resynthesis under optimal conditions requires 24 to 48 hours. The rate of glycogen resynthesis is not uniform across that window. It is highest in the first 30 to 60 minutes post-exercise, when GLUT-4 transporter expression is elevated and the muscle's glucose uptake capacity is at its peak.(Piehl Aulin et al. 2000)
The physiological basis for post-exercise carbohydrate intake is this uptake window: consuming carbohydrate in the first 30 to 60 minutes post-session capitalizes on elevated GLUT-4 activity to accelerate resynthesis. Missing this window does not prevent resynthesis, but it slows the process, compressing available recovery time before the next session.
Under suboptimal conditions (caloric restriction, low carbohydrate intake, insufficient sleep, or additional high-intensity training before resynthesis completes), glycogen stores enter the next session partially depleted. Each session compounds the prior deficit. Cumulative partial depletion is one of the primary mechanisms behind the progressive performance degradation seen in multi-session training blocks where recovery inputs are consistently inadequate.
24–72 Hours: Tissue Repair and the Inflammatory Window
Mechanical stress from high-intensity or resistance training produces micro-damage to muscle fibers. The inflammatory response is a repair signal, not a malfunction: a precisely orchestrated sequence with specific phases. Neutrophil infiltration begins within hours of the session and peaks between 6 and 24 hours. Macrophage-mediated tissue remodeling and inflammatory resolution extend through 48 to 72 hours.
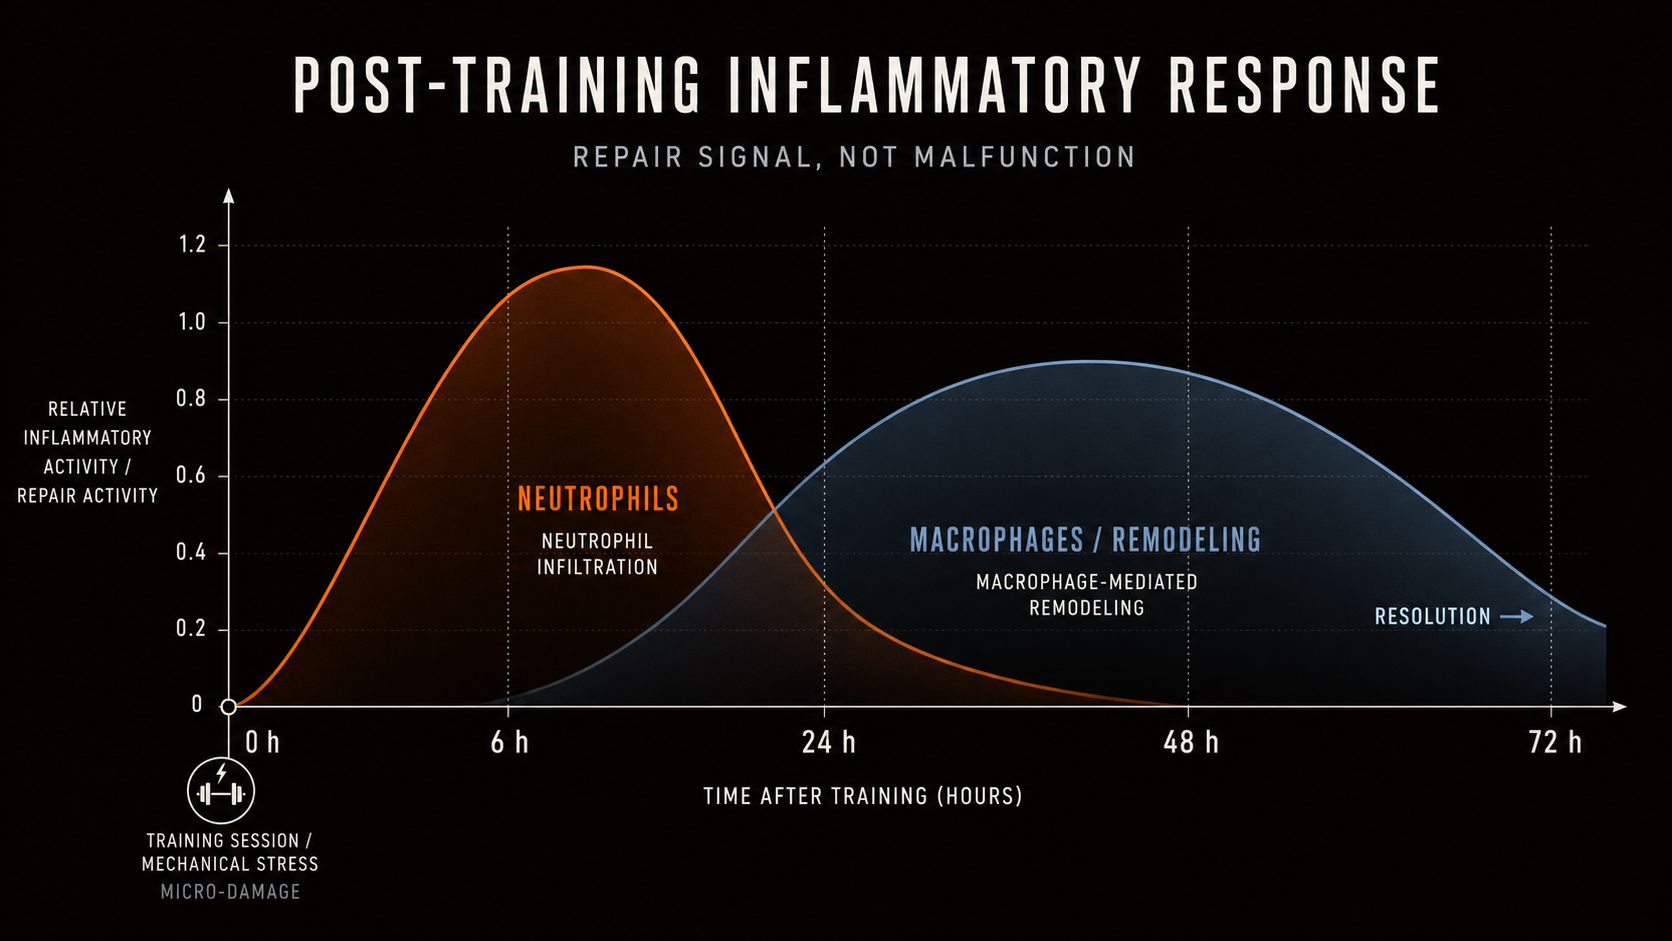
Muscle protein synthesis is upregulated during this window as damaged contractile proteins are rebuilt. Synthesis peaks in the 24 to 48 hours post-session and requires adequate protein availability to complete: the structural material must be present for the repair to finish. Adding another high-intensity session, severely reducing caloric intake, or shortening sleep during this window does not compress the process. It truncates it. The training stimulus creates the adaptation signal; the recovery window is where the structural change completes. Interrupting it delays the outcome.
Overnight: Sleep, Growth Hormone, and Hormonal Restoration
Sleep is the primary hormonal recovery window in the 24-hour cycle, not a period of passive reduced activity. The distinction is mechanistic: specific anabolic processes are time-gated to sleep, running predominantly during sleep and largely absent during wakefulness regardless of how low-stress the waking hours are.
Approximately 70% of daily growth hormone secretion occurs during slow-wave sleep, concentrated in the first half of the night after growth hormone drives tissue repair, supports glycogen resynthesis, and mobilizes fat for fuel during recovery (Van Cauter et al. 2000). This pulse is not compressed into a shorter window when sleep is restricted: it is truncated. An athlete sleeping six hours does not receive six hours of GH secretion at a faster rate. The pulse ends sooner, reducing total output.
Cortisol follows a complementary pattern. It is elevated post-exercise as part of the acute stress response and normalizes during adequate sleep as the HPA axis resets overnight. Chronic sleep restriction maintains elevated cortisol into the recovery window, suppressing the anabolic processes sleep was supposed to deliver while creating a catabolic hormonal environment at precisely the time repair should be occurring.
The GH pulse is truncated, not compressed, when sleep is cut short
About 70% of nightly growth hormone secretion occurs in slow-wave sleep, concentrated in the first half of the night. Cut sleep short and the pulse doesn't speed up to finish on time — it just stops. Cortisol shows the mirror problem: it normally normalizes overnight, but with restricted sleep it stays elevated into the recovery window.
GH secreted so far (% of full-night potential)
—
Cortisol level vs. resting baseline
—
For sleep and recovery in athletes under meaningful training load, the evidence-based range is 8 to 10 hours per night (Milewski et al. 2014). This exceeds the general-population recommendation because growth hormone secretory demand, glycogen depletion and resynthesis requirements, and motor consolidation load are all higher in athletes training regularly at intensity.
3–5 min
PCR FULLY RESTORED
24–48h
GLYCOGEN RESYNTHESIS
~70%
DAILY GH SECRETED DURING SWS
“The training stimulus creates the adaptation signal; the recovery window is where the structural change completes.”
“An athlete sleeping six hours does not receive six hours of GH secretion at a faster rate. The pulse ends sooner, reducing total output.”
Where the Model Gets Misread — Functional Overreaching and Its Costs

The most common error in training management is interpreting accumulated fatigue as insufficient fitness. The response, training harder and training more, amplifies the fatigue signal without a proportional increase in the fitness signal. This widens the performance gap rather than closing it, because the athlete is operating deeper into the fatigue side of the fitness-fatigue equation with each session.
Functional overreaching (FOR) is a planned, recoverable state in which training load deliberately exceeds recovery capacity for a defined period. The intent is to accumulate fatigue strategically, then taper, allow that fatigue to dissipate faster than fitness, and capture the supercompensation response described earlier. FOR is a standard tool in periodized training. Its markers include elevated perceived effort at fixed loads, mild mood disturbance, and reduced performance, all of which resolve within two weeks of reduced load. Functional overreaching symptoms of this type are expected, not problematic, when adequate recovery follows(Meeusen et al. 2013).
Non-functional overreaching (NFOR) develops when the FOR state extends without adequate recovery. The markers change in kind, not just degree: HPA axis dysregulation begins, HRV trends downward across multiple days, resting heart rate rises, sleep architecture degrades, and mood disturbance deepens and persists. Functional overreaching symptoms that continue beyond two weeks signal the transition from FOR to NFOR, a state requiring weeks to months to resolve, not days. Misreading NFOR as FOR and adding load at that point accelerates progression toward overtraining syndrome, which requires months of recovery.
The second common error is treating rest days as passive lapses. The recovery processes described in the previous section are active biological sequences with specific input requirements: carbohydrate and protein for substrate resynthesis and tissue repair, adequate sleep for hormonal restoration, reduced training stress for autonomic recovery. A rest day without those inputs is not a recovery day; it is a day when the system fails to complete the cascade the previous session initiated.
The third error is interpreting fatigue signals as motivational ones. Declining output at fixed effort, elevated resting heart rate, reduced appetite, and worsening mood are physiological outputs of accumulated fatigue. In the NFOR state, these signals indicate that the system is deepening a deficit rather than adapting. Treating them as motivation problems and increasing training load in response makes the physiological situation worse, not better.
FUNCTIONAL OVERREACHING (FOR)
Planned. Recoverable.
Training load exceeds recovery capacity intentionally. Performance and mood return to baseline within two weeks of reduced load. Part of structured periodization.
NON-FUNCTIONAL OVERREACHING (NFOR)
Unplanned. Weeks to Months.
FOR state extended without adequate recovery. HPA axis dysregulates, HRV declines, resting HR rises. Recovery requires weeks to months, not days.
“Functional overreaching symptoms that continue beyond two weeks signal the transition from FOR to NFOR, a state requiring weeks to months to resolve, not days.”
“Declining output at fixed effort, elevated resting heart rate, reduced appetite, and worsening mood are physiological outputs of accumulated fatigue.”
Reading Your Fatigue State — The Acute-Chronic Workload Ratio and Practical Signals

Given the mechanisms described, fatigue management in practice is not about eliminating fatigue; it is about accumulating it in a ratio to fitness that allows adaptation to emerge. The acute-chronic workload ratio (ACWR) provides a framework for quantifying that relationship.
The ACWR compares recent training load (typically the previous 7 days) against an established baseline load (typically the previous 28 days). A ratio between 0.8 and 1.3 represents a zone where acute load is consistent with chronic capacity: the system is working hard relative to what it has adapted to handle, but within a range where adaptation is the likely outcome. Ratios above 1.5 consistently correlate with significantly elevated injury risk and performance decline.(Gabbett 2016; Hulin et al. 2016). Ratios below 0.8 indicate that training stimulus has dropped below the level required to sustain existing adaptations.
The ACWR translates the fitness-fatigue model into a trackable metric. What it measures is not fatigue directly, but the gap between what the athlete has recently done and what the system has adapted to handle. A high ratio means fatigue is outpacing adaptation capacity. A high chronic load, the denominator, is protective, because it reflects a high adaptation baseline that makes the same acute load less disruptive to the system.
Heart rate variability (HRV) and resting heart rate provide a complementary signal at the autonomic level. A sustained downward trend in HRV across 7 to 14 days, paired with a rising resting heart rate, signals accumulating CNS fatigue that precedes obvious performance decline. These are early-warning markers, not lagging indicators; they become actionable before the performance problem becomes severe. The limitation is that a single data point is noise; calibration requires a personal baseline established over weeks of consistent measurement.
Using these signals accurately requires treating the data as probabilistic rather than diagnostic, building enough measurement history to distinguish signal from normal day-to-day variation, and making decisions that reflect what the system currently tolerates rather than what training targets demand.
The acute:chronic workload ratio tracks the fatigue-vs-adaptation gap
ACWR compares the last 7 days of training load against the last 28. Between 0.8 and 1.3, load is consistent with what the athlete has adapted to handle. Above 1.5, injury risk and performance decline rise sharply.
ACWR (7-day : 28-day)
—
Training zone
—
0.8–1.3
MANAGEABLE ACWR ZONE
>1.5
ELEVATED INJURY RISK THRESHOLD
“A high chronic load is protective, because it reflects a high adaptation baseline that makes the same acute load less disruptive to the system.”
“A single data point is noise; calibration requires a personal baseline established over weeks of consistent measurement.”
Frequently Asked Questions
How long does muscle recovery take after a hard workout?
Recovery operates on at least five overlapping timelines. Phosphocreatine restores within 3 to 5 minutes. Glycogen takes 24 to 48 hours under adequate carbohydrate intake. Tissue repair and muscle protein synthesis continue through 48 to 72 hours. Sleep-gated hormonal restoration, including growth hormone secretion, occurs overnight, every night. No single number covers all of these processes simultaneously.
Why does extreme fatigue after exercise sometimes peak the day after training?
Short-term fatigue peaks 24 to 48 hours post-session because glycogen resynthesis is still incomplete and cortisol remains elevated above baseline during that window. These conditions reduce readiness and slow repair. The session itself may not have been excessive; the incomplete recovery in the following 24 to 48 hours is what degrades readiness for the next effort.
What is the difference between functional overreaching and overtraining syndrome?
Functional overreaching is a planned state in which training load deliberately exceeds recovery capacity for a defined period, with performance and mood returning to baseline within two weeks of reduced load. Overtraining syndrome is a pathological state reached when chronic fatigue accumulates without adequate recovery, requiring months to resolve. Non-functional overreaching is an intermediate stage, resolving over weeks to months.
How does sleep affect muscle recovery and adaptation?
Approximately 70% of daily growth hormone secretion occurs during slow-wave sleep. Growth hormone drives tissue repair, supports glycogen resynthesis, and regulates fat metabolism during recovery. Chronic sleep restriction truncates this hormonal pulse and maintains elevated cortisol, creating a catabolic environment during the recovery window. Athletes under meaningful training load need 8 to 10 hours per night.
What does the acute-chronic workload ratio measure?
The acute-chronic workload ratio compares recent training load (typically the past 7 days) against an established baseline (the past 28 days). It quantifies the gap between what the athlete is currently doing and what the system has adapted to handle. A ratio between 0.8 and 1.3 is manageable; ratios above 1.5 consistently correlate with elevated injury risk.
The Bottom Line
The same stimulus that builds fitness also builds fatigue. There is no adaptation pathway that separates the two. What distinguishes athletes who progress over years from those who plateau or break down is the accuracy of their model for managing the relationship between these signals, not the volume of work they accumulate.
Recovery is the biological window in which the adaptation the training stimulus created actually completes. Cutting it short does not accelerate the process. The structural changes that produce improved capacity happen during recovery, not during the session. Shortening or disrupting the recovery window consistently means the training stimulus is generating a signal that the system never fully converts into adaptation.
Durability, the ability to maintain output deep into a prolonged effort, is the accumulated product of a system that has been allowed, through thousands of well-managed sessions, to build resistance to fatigue accumulation. It is measured at hour three, in the final exchanges, when the athlete whose system has adapted is still producing close to established output and the one whose system has been chronically over-stressed is not. It does not appear in a peak test. It appears under load, over time.
“Durability is measured at hour three, in the final exchanges, when the athlete whose system has adapted is still producing close to established output and the one whose system has been chronically over-stressed is not.”
Fatigue and fitness are the same event, counted twice. The athlete who understands this manages one; the one who doesn't keeps fighting the wrong thing.
Every training session produces both a debt and a deposit. Recovery is when the deposit clears. Cut it short and the deposit stays pending.
Mydos Performance
— Fatigue, Recovery and Durability Series —
How Long Does Muscle Recovery Take? Fatigue, Recovery, and Durability Explained
What the training stimulus actually produces, and what it costs to collect it
· By Ricardo Londono, MD/PhD ·