
Your VO2 Max Score Is Not a Performance Score
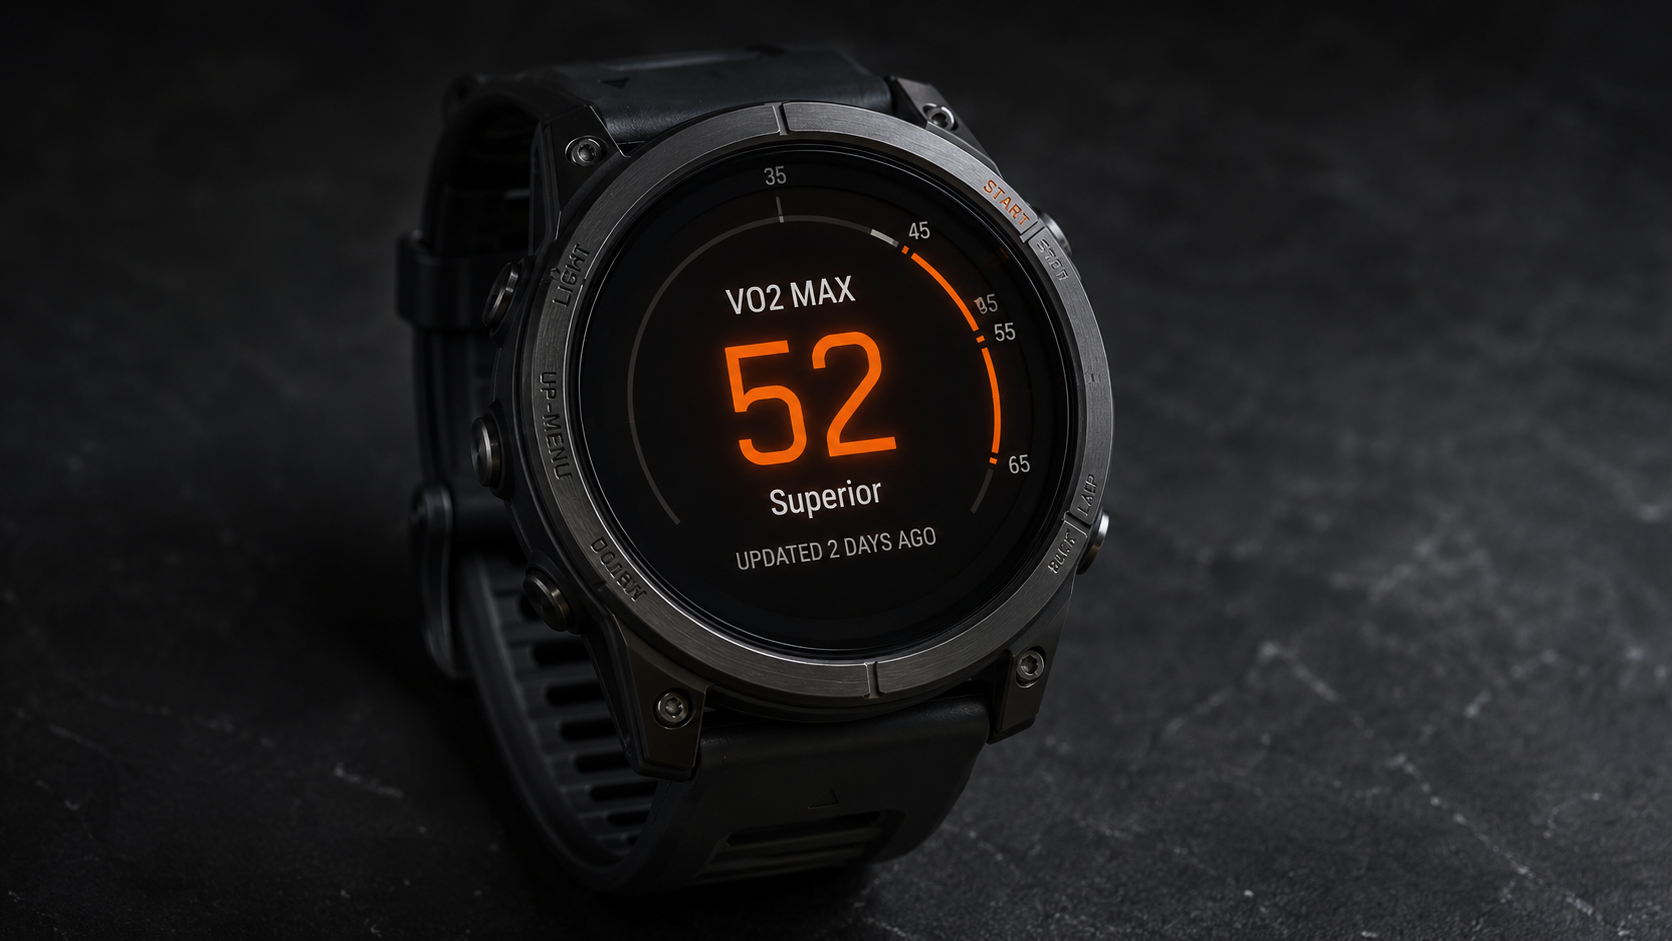
Any serious athlete who trains with a heart rate monitor and has spent time with a GPS watch knows their VO2 Max score. The average VO2 max by age follows a predictable curve for male athletes: values typically peak in the mid-to-late 20s, hold reasonably stable through the 30s in active individuals, then decline at roughly 1% per year after approximately age 35 (Fleg et al. 2005). Normative data from the FRIEND Registry, which collected directly measured VO2 Max from cardiopulmonary exercise testing across thousands of US adults, provides age-stratified reference ranges by fitness level for men and women (Kaminsky et al. 2015). For context, trained men in their 30s typically score in the 50-60 mL/kg/min range, highly trained endurance athletes sit at 60-70, and those in their late 40s and 50s who remain active cluster in the 40-55 range depending on training history.
The comparison question, whether a given score is good for a given age, is reasonable. It tells you something real: which physiological tier you are working from, and how your cardiovascular system compares to an age-matched reference population. However, the score comparison has a ceiling on its usefulness. Two athletes with identical VO2 Max values can produce performance outcomes that differ by 15-20% (Joyner & Coyle 2008). VO2 Max sets the upper boundary on aerobic power. It does not describe how close to that boundary performance actually runs, or how efficiently the body converts aerobic capacity into mechanical output.
Three variables together determine endurance performance: VO2 Max, lactate threshold, and running economy. All three are independent. A change in one does not require or guarantee a change in the others. Understanding each variable, and how they interact, produces a more accurate and actionable picture of performance capacity than comparing a single ceiling score against population norms.
50–60
mL/kg/min — Trained Men in Their 30s
44–52
mL/kg/min — Trained Men in Their 40s
15–20%
Performance Gap at Identical VO2 Max
Source: Normative ranges from Kaminsky et al. 2015 (PMID 26455884); performance variance from Joyner & Coyle 2008 (PMID 17901124)
Three variables together determine endurance performance: VO2 Max, lactate threshold, and running economy. All three are independent.
What VO2 Max Actually Measures
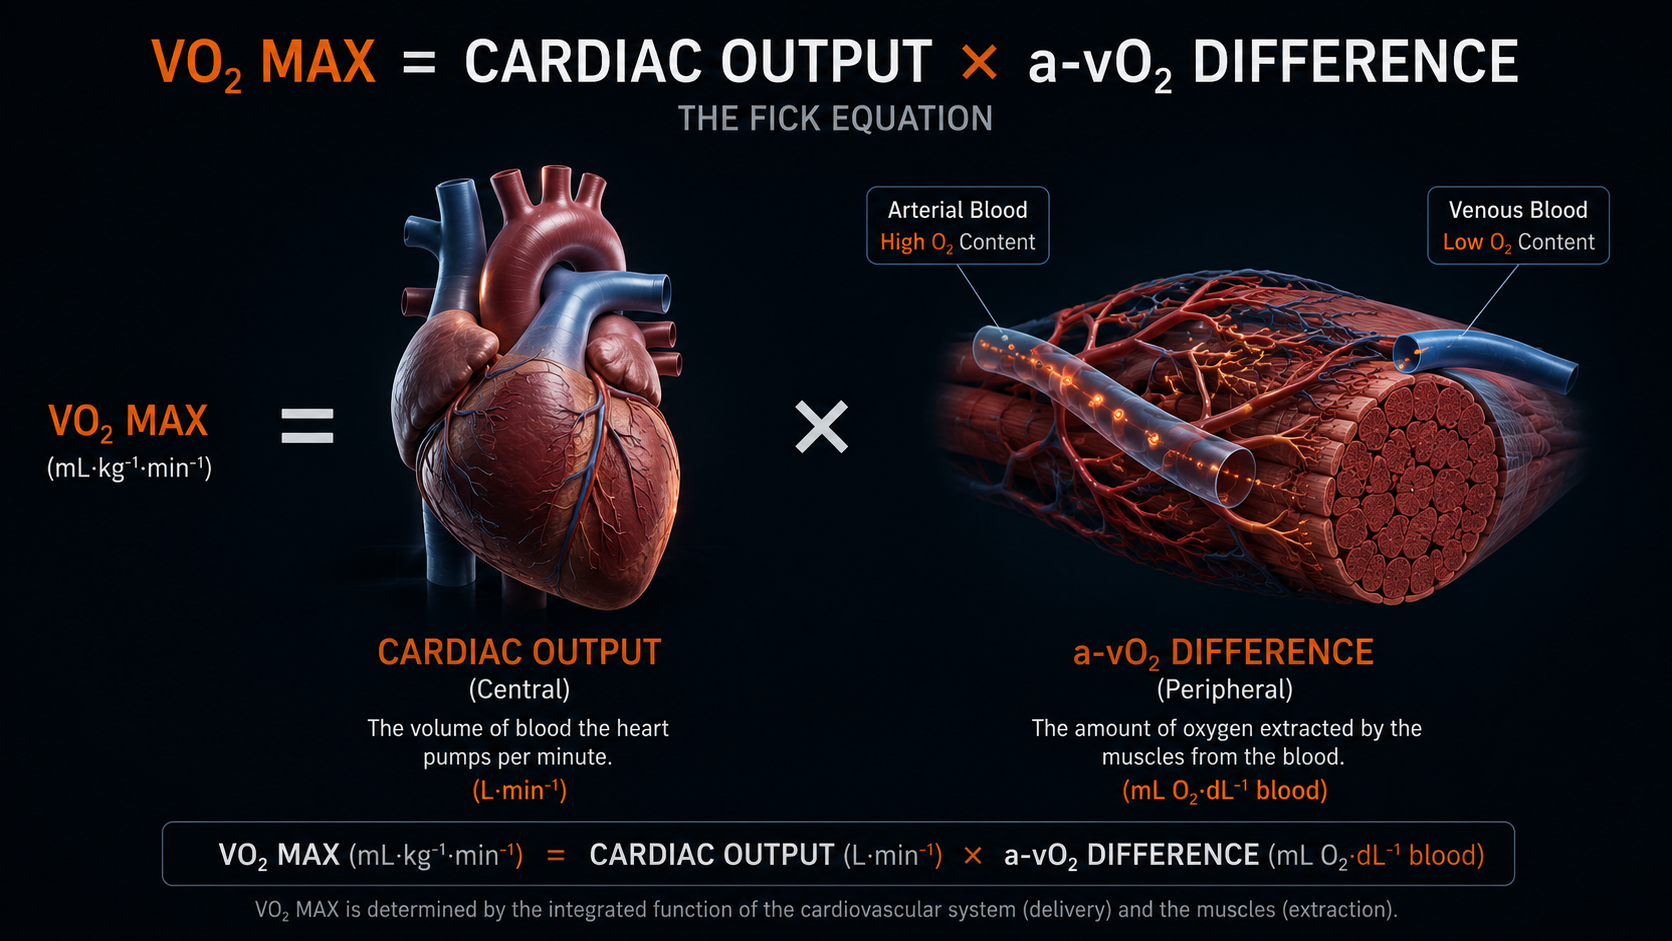
The Fick Equation: Two Components, One Number
VO2 Max is defined by the Fick equation: VO2 Max equals cardiac output multiplied by the arteriovenous oxygen difference, also written as the a-vO2 difference. This is the actual physiological relationship, not a simplified approximation.
Cardiac output, the central component, is the product of stroke volume and maximum heart rate. It represents the upper limit on how much oxygen-rich blood the heart can deliver to working muscles per minute. The arteriovenous oxygen difference, the peripheral component, is the difference between the oxygen content of arterial blood leaving the heart and venous blood returning from working muscles. It measures how much of the delivered oxygen the muscles actually extract and metabolize during exercise (Bassett & Howley 2000, Med Sci Sports Exerc 32(1):70-84 — PMID pending manual verification).
The composite score that appears on a lab printout or a wearable combines both components into one number without indicating which is driving it. A high VO2 Max can reflect a large cardiac output, highly efficient peripheral oxygen extraction, or both. This distinction matters because these two components respond differently to training. Central adaptations, specifically increases in stroke volume and therefore cardiac output, develop relatively quickly with training and reach their trainable ceiling faster. That ceiling is substantially constrained by genetics. Peripheral adaptations, including mitochondrial density, capillary density, and oxidative enzyme capacity in working muscles, develop more slowly over months and years of sustained training, and they have a longer runway for improvement in most athletes.
CENTRAL COMPONENT
Cardiac Output
Stroke volume × maximum heart rate. Determines the upper limit on oxygen delivery to muscles. Fast to adapt with training; ceiling is substantially genetically constrained.
PERIPHERAL COMPONENT
a-vO2 Difference
How much delivered oxygen working muscles actually extract and metabolize. Determined by mitochondrial density, capillary density, oxidative enzyme capacity. Slower to adapt; longer trainable runway.
A plateaued VO2 Max score does not necessarily mean both components have stopped responding. The peripheral extraction component may still be trainable after the central component has reached its individual limit.
The Three-Determinant Model: Ceiling, Threshold, Economy
Endurance performance is a function of three independent physiological variables: VO2 Max, lactate threshold, and running economy (Joyner & Coyle 2008). These three variables are independent. A training intervention that raises the ceiling does not necessarily move the threshold fraction or improve the economy, because each variable has a distinct physiological basis and responds to distinct training inputs.
Consider two athletes with identical VO2 Max scores of 65 mL/kg/min. Athlete A sustains effort at a lactate threshold equal to 72% of maximum; Athlete B at 85%. Athlete B's sustainable aerobic output is approximately 18% higher despite an identical ceiling. In a group of 14 well-trained cyclists with similar VO2 Max values, Coyle et al. found that lactate threshold fraction accounted for over 92% of the variance in performance outcomes (Coyle et al. 1988). The ceiling was held constant; the fraction defined who performed better.
THE THREE PERFORMANCE DETERMINANTS
VO2 Max
The aerobic ceiling. Sets the upper boundary on how much oxygen the body can consume per minute during maximal effort.
Lactate Threshold
The sustainable fraction. The highest exercise intensity at which blood lactate production matches the rate of clearance.
Running Economy
The efficiency multiplier. Oxygen consumed per unit of mechanical work at a given pace. Lower is more efficient.
Within trained populations, where ceilings are already elevated, threshold fraction and running economy explain more performance variance than the ceiling itself. This is why elite runners with moderate VO2 Max scores can outperform those with higher ceilings but inferior threshold training.
Lactate Threshold vs. VO2 Max: The Variable That Predicts More
Lactate threshold is the highest exercise intensity at which the rate of lactate production in working muscles does not exceed the rate at which the liver and other tissues can clear lactate from the blood. Above this threshold, lactate accumulates progressively, and the duration of sustainable effort becomes limited by this accumulation process.
The threshold is typically expressed as a percentage of VO2 Max. Trained recreational athletes tend to sustain approximately 65-75% of their VO2 Max at threshold intensity (Coyle et al. 1988); more competitive athletes sustain 80-85%; and competitive endurance athletes sustain 88-92% [reference pending verification]. These percentage differences, applied to an identical ceiling, produce large differences in sustainable pace. An athlete who moves from 72% to 82% of an unchanged VO2 Max ceiling has increased effective aerobic output by 10% with no change in maximum cardiac output.
65.8%
Low-Threshold Group LT Fraction
81.5%
High-Threshold Group LT Fraction
2×
Performance Duration Advantage (High vs Low LT Group)
Source: Coyle et al. 1988 (PMID 3403447) — 14 well-trained cyclists with similar VO2 Max values
The mechanistic basis of lactate threshold is primarily peripheral, not central. Threshold is determined by mitochondrial density and the activity of oxidative enzymes, specifically succinate dehydrogenase and citrate synthase, in slow-twitch muscle fibers. These are properties of the muscles themselves. They respond to training volume and intensity distribution over months and years, and they have a longer improvement window in most trained athletes than maximum cardiac output does.
Running Efficiency: Why Two Identical VO2 Max Scores Produce Different Performances
Running efficiency, the term used here interchangeably with running economy, is the oxygen consumed per unit of mechanical work at a given pace. Lower oxygen cost per kilometer means more aerobic capacity is available before the ceiling is reached. Two athletes with identical VO2 Max scores and identical threshold fractions can produce meaningfully different race outcomes if their economy differs.
Economy is determined by multiple factors operating at different levels. Stride mechanics and elastic energy return from tendons and fascial structures account for a portion of inter-individual variation. Muscle fiber composition contributes because slow-twitch fibers are inherently more economical at aerobic intensities than fast-twitch fibers. Neuromuscular coordination affects how efficiently the mechanical system operates per contraction cycle. At the cellular level, mitochondrial efficiency, specifically how much ATP is produced per molecule of oxygen consumed, affects economy independently of mitochondrial density. This is a distinct mechanism from the enzyme-capacity changes that drive threshold improvements, and it responds to different inputs. Proposed mechanisms of action for certain botanical interventions, including cordyceps sinensis, are documented in terms of effects on ATP synthesis pathways and cellular oxygen utilization efficiency at this level.
Within trained populations, where ceilings are already elevated, threshold fraction and running economy explain more performance variance than the ceiling itself.
Well-documented inter-individual differences in running economy between athletes at equivalent VO2 Max and threshold are sufficient to explain meaningful performance gaps across distances from the 5K to the marathon.
A plateaued VO2 Max score does not necessarily mean both components have stopped responding. The peripheral extraction component may still be trainable after the central component has reached its individual limit.
What VO2 Max Decline With Age Actually Means for Your Performance

VO2 Max declines at approximately 1% per year after its peak, with the rate of decline accelerating substantially after age 70 (Fleg et al. 2005). The primary driver of this decline is a reduction in maximum stroke volume, the central component. Maximum heart rate also declines with age, further reducing the cardiac output ceiling. These are structural changes in the cardiovascular system that training can slow but not reverse.
Normative data from the FRIEND Registry provides age-stratified reference ranges by fitness tier for men across the 20s through 70s (Kaminsky et al. 2015). A trained 45-year-old male with a VO2 Max of 48 mL/kg/min is at a meaningfully different percentile than an untrained 45-year-old with the same score, and both are at a different percentile than they would be if the same value appeared in a 30-year-old. Interpreting a number without its fitness-tier context produces a misleading picture of where the athlete actually stands.
The peripheral component, the a-vO2 difference, declines more slowly than the central component and remains more responsive to training into the 50s and 60s. Mitochondrial density, oxidative enzyme activity, and capillary density respond to training stimulus at 50 in a way that is similar in direction, if reduced in magnitude, to their response at 35. This creates a meaningful asymmetry: as the ceiling lowers, the fraction of that ceiling that an athlete can sustain at threshold, and the efficiency with which oxygen is converted to output, can often be preserved or improved.
Average VO2 Max for Trained Men by Decade
30s
~50–60 mL/kg/min
100%
40s
44–52 mL/kg/min
~87%
50s
40–48 mL/kg/min
~80%
Source: Normative ranges from Kaminsky et al. 2015 (PMID 26455884). Values represent approximate ranges for active/trained men; percentile position varies by fitness level within each decade.
Tanaka and Seals reviewed masters athlete physiology in detail and found that performance decline in highly trained older athletes is substantially smaller than VO2 Max decline alone would predict (Tanaka & Seals 2008). Masters athletes who maintain consistent training preserve threshold fraction and running economy even as the ceiling lowers. Sedentary individuals show greater age-related VO2 Max decline than active individuals (Tanaka & Seals 2008), which explains why population data on aerobic aging often looks worse than the picture for a trained individual. The ceiling is falling. But the ceiling falling is not the same as the performance system deteriorating at the same rate.
The peripheral component of VO2 Max, the a-vO2 difference, declines more slowly than the central component and remains more responsive to training into the 50s and 60s.
Masters athletes who maintain consistent training preserve threshold fraction and running economy even as the ceiling lowers.
Three Ways Athletes Misread Their VO2 Max Data

How Garmin Calculates VO2 Max: Why the Method Matters
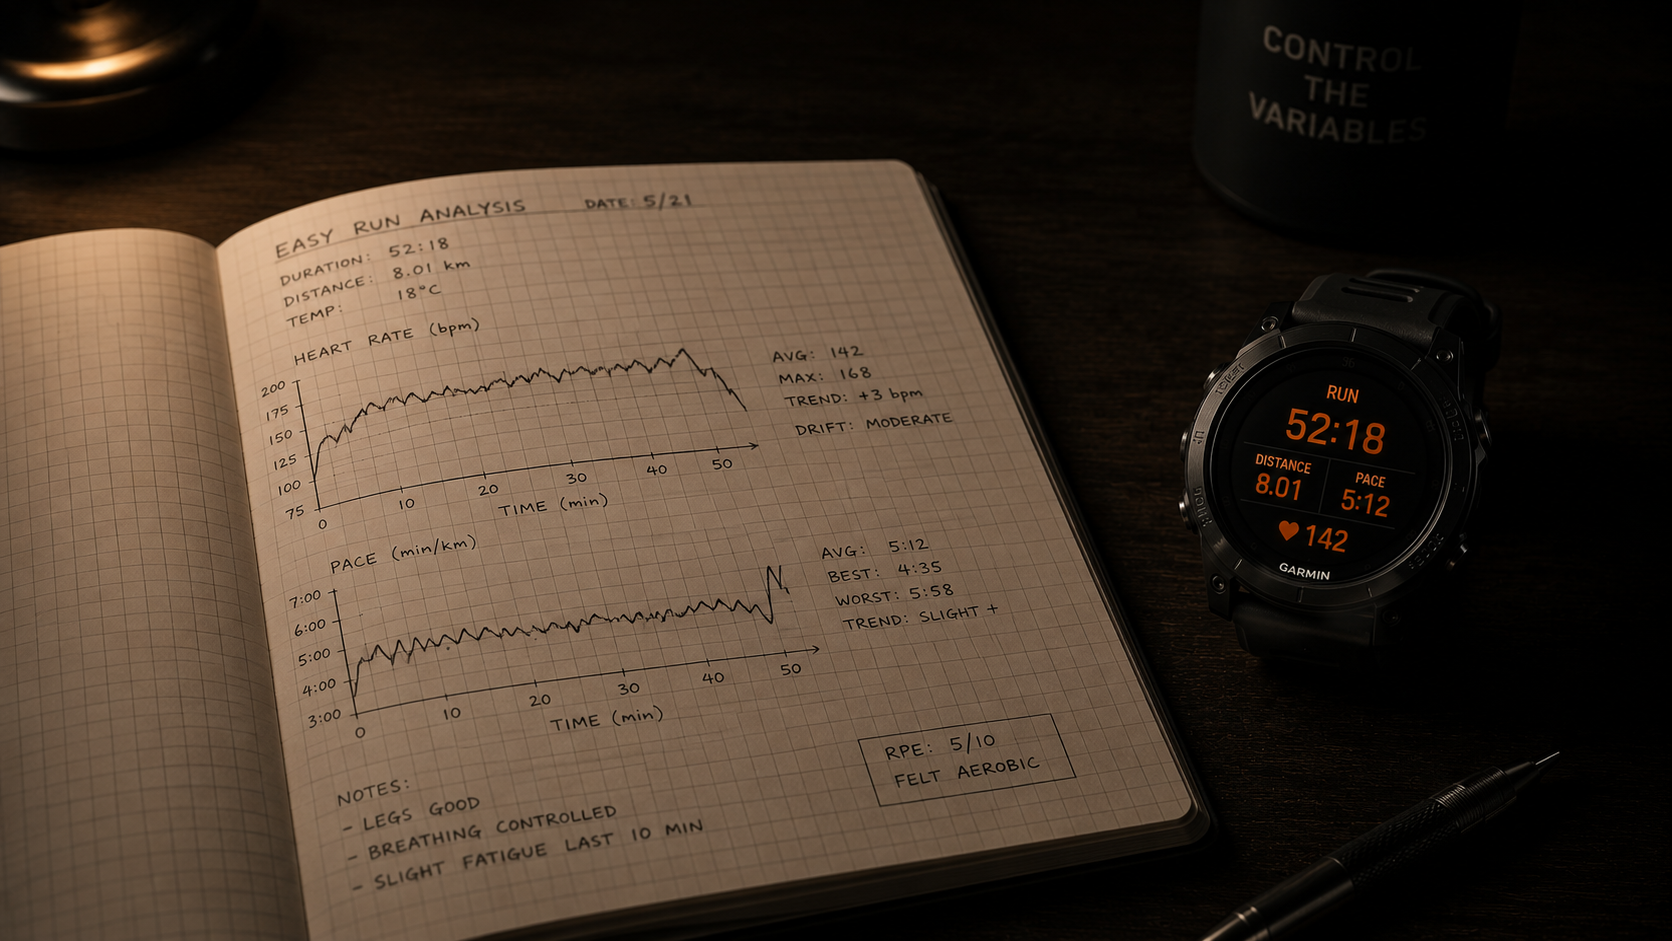
The VO2 Max score on a Garmin device is an algorithmic output, not a direct physiological measurement. Understanding how Garmin calculates VO2 Max makes clear why the number is a trend indicator rather than a precise readout. The algorithm estimates VO2 Max by comparing the relationship between effort, indexed as heart rate, and output, indexed as running pace, across sessions. It fits that effort-to-output ratio to a predictive model calibrated against laboratory data. No gas exchange is measured. No blood sample is taken. The algorithm infers what the physiological measurement would be based on the relationship between two readily available signals.
This estimation approach depends on consistent conditions. The algorithm assumes flat terrain, accurate heart rate data from the optical sensor, and the absence of significant confounding variables including heat, altitude, accumulated training fatigue, caffeine, or disrupted sleep. Any of these factors can alter the effort-to-output relationship without any change in actual aerobic ceiling, producing a score fluctuation that reflects data quality, not fitness change.
How Accurate Is Apple Watch VO2 Max: What the Data Shows
Consumer wearable VO2 Max estimates carry meaningful error margins that most athletes underestimate. Validation research examining how accurate Apple Watch VO2 max estimation is against laboratory-measured values has consistently found deviations of several mL/kg/min under typical testing conditions [citation pending PMID verification]. The device tends to underestimate VO2 Max in highly fit individuals and overestimate in those with lower fitness, meaning the error is systematic and fitness-dependent rather than random.
4.1
Treating the Estimate as a Measurement
Garmin and Apple Watch derive VO2 Max from effort-to-output ratios, not gas exchange. Conditions including heat, altitude, or accumulated fatigue shift the estimate without any change in actual aerobic ceiling.
4.2
Misreading Wearable Accuracy Limits
Consumer wearables carry meaningful error margins against lab-measured values. Single-session readings and small fluctuations are noise. Consistent directional trends over 6-12 week blocks are informative.
4.3
Chasing the Ceiling When Threshold Is the Limiter
A plateaued VO2 Max does not mean performance has capped. Threshold fraction typically has room to improve, responds to different training inputs than interval work, and carries lower fatigue cost per performance gain.
A deviation of several mL/kg/min on a score of 48 spans a range that crosses multiple normative fitness tier bands. Using a wearable estimate to compare scores or calibrate a precise training target assumes a level of measurement precision the algorithm does not provide. The more appropriate use is to observe directional trends over 6-12 week training blocks.
Chasing the Ceiling When Threshold Is the Limiter
An athlete with a plateaued VO2 Max is at a performance ceiling only if their threshold fraction and running economy have also plateaued near their individual limits. In most trained but non-elite athletes, this is not the case. Threshold fraction typically has meaningful room to improve even when the ceiling has stopped rising.
A 1-2 point drop after a hard training week, a run in high heat, or a session with wrist sensor drift is a measurement artifact.
The common response to a plateaued VO2 Max score is to add high-intensity interval training aimed at pushing the ceiling higher. This is not an incorrect approach in principle, but it is frequently applied in situations where a different training stimulus would produce better performance returns. Tempo work and sustained training near and slightly below lactate threshold are the primary inputs for raising the threshold fraction. For an already-fit athlete with a stalled ceiling, the marginal performance return on additional interval volume is lower than the marginal return on well-structured threshold work, and the accumulated fatigue cost is higher. Misidentifying the operative limiter and training the wrong variable is one of the most consistent patterns in performance stagnation for trained athletes.
Misidentifying the operative limiter and training the wrong variable is one of the most consistent patterns in performance stagnation for trained athletes.
Using the Three-Variable Model as a Diagnostic
The three-determinant framework is most useful as a diagnostic tool. The question it answers is: given a current training history and performance trajectory, which of these three variables is the operative limiter?
If VO2 Max is rising but performance is not improving proportionally, threshold fraction or economy has likely not kept pace with the ceiling. The training inputs that raise the ceiling and those that improve the fraction are different, and one does not automatically produce the other. If VO2 Max has plateaued and performance continues to improve, threshold and economy are still developing, and the ceiling plateau has not yet become the constraining variable. These are diagnostic interpretations of the same number that require the three-variable frame to be useful.
For the athlete in their 40s or 50s, the peripheral components provide the more tractable target. Maximum cardiac output declines with age for structural reasons that training can slow but not reverse. Mitochondrial density and oxidative enzyme capacity respond to training inputs at 45 in a way that is meaningfully similar in direction to their response at 35, even if the magnitude of adaptation is reduced. Shifting training emphasis toward preserving and developing the peripheral variables, threshold fraction and economy, is more productive at this stage. Interventions that act on cellular oxygen utilization at the mitochondrial level, whether training adaptations or nutritional inputs, operate through this peripheral mechanism rather than the central cardiac one.
WHEN THE CEILING STALLS
The Limiter Isn't the Ceiling
A plateaued VO2 Max with continuing performance improvement signals threshold and economy still developing. The ceiling has not yet become the constraining variable.
WHEN THE CEILING FALLS
Peripheral Components Remain Trainable
For athletes in their 40s-50s, mitochondrial density and oxidative enzyme capacity respond to training even as cardiac output declines. Threshold fraction and economy are the productive targets.
The productive question shifts from "what is my number?" to "which variable is currently limiting how I perform?"
Frequently Asked Questions
Why is my VO2 Max decreasing?
VO2 Max declines at roughly 1% per year after age 35, primarily because maximum stroke volume decreases with age, reducing the ceiling on oxygen delivery to working muscles. Active individuals lose VO2 Max more slowly than sedentary ones. A declining number does not mean performance is dropping at the same rate, because lactate threshold and running economy can be preserved independently.
How does Garmin calculate VO2 Max?
Garmin's VO2 Max estimate is derived from the relationship between heart rate and running pace across sessions. The algorithm compares effort to output and fits that ratio to a predictive model calibrated on laboratory data. It assumes consistent conditions; factors like heat, altitude, or accumulated fatigue can shift the estimate without any change in actual aerobic ceiling.
Is Garmin VO2 Max accurate?
Garmin VO2 Max estimates are a useful directional signal but carry a meaningful error margin compared to lab-measured values. The algorithm performs better under stable conditions with accurate heart rate data. Single-session readings and small point-to-point fluctuations should be treated as noise; consistent directional trends over 6-12 week training blocks are more informative than any individual measurement.
What is a good VO2 Max for my age?
Normative ranges vary by age, sex, and fitness level. Trained men in their 40s typically score 44-52 mL/kg/min; in their 50s, roughly 40-48. The score tells you where your aerobic ceiling sits, not how close to it you perform. Within trained populations, lactate threshold and running economy explain more performance variance than the ceiling score alone.
What is the relationship between VO2 Max and lactate threshold?
VO2 Max sets the aerobic ceiling; lactate threshold determines what fraction of that ceiling you can sustain in performance. The two are independent: a high VO2 Max does not guarantee a high threshold fraction. In trained populations with matched VO2 Max scores, lactate threshold fraction consistently predicts performance outcomes better than the ceiling value alone.
What the Number Tells You, and the Question It Can't Answer
VO2 Max tells you accurately where your aerobic ceiling sits. This information has real value. It tells you the physiological tier you are working from, the upper boundary of your aerobic power output, and roughly how your cardiovascular system compares to a population of your age and sex.
What the number does not tell you is how close to that ceiling your performance actually runs. Two athletes who share a ceiling can perform very differently depending on how high a fraction of it they can sustain without accumulating lactate, and how efficiently they convert oxygen intake to mechanical output at that fraction. Those two variables, threshold and economy, are the ones that predict performance within trained populations, that respond to training inputs over years when the ceiling has plateaued, and that remain trainable in the 40s and 50s when the central cardiac ceiling is declining for structural reasons.
For the aging athlete, the relevant insight is that the ceiling lowering is not equivalent to performance declining at the same rate. The peripheral components can be preserved and sometimes improved as the ceiling lowers. An athlete who understands this can continue producing real performance progress by training the right variables rather than managing a ceiling metric that is increasingly constrained by biological changes no training volume can reverse.
The ceiling is real. The fraction and the efficiency are what you actually perform at.
VO2 Max marks where your ceiling is. Threshold and economy determine where you actually perform.
Within trained populations, the ceiling is rarely what separates athletes. The fraction of that ceiling they can sustain, and the efficiency with which they use it, is what makes the performance difference — and both remain trainable even as the ceiling lowers with age.
Mydos Performance
— What Actually Limits Performance Series —
Average VO2 Max by Age: What Your Number Actually Means (And What It Doesn't)
Three variables determine endurance. Most athletes only track one.
By Ricardo Londono, MD/PhD · 2026